Microsoft’s Power Platform (comprising of Power BI, Power Automate and Power Apps) has a wealth of business benefits. It makes it easier for businesses to embrace innovation and implement efficient, low-code solutions.
Power BI in particular brings advantages when it comes to data visibility and analysis. It makes it easy to share insights across your teams and tell meaningful stories about your data. This, in turn, empowers internal understanding and decision-making.
Power BI for Desktop is a powerful and much-loved tool for many businesses. In this blog, we explore everything you need to know about it, including how to get started.
What is Power BI?
Power BI is a business intelligence tool, allowing users to visualise raw data and change it into actionable insights.
Power BI consists of several elements that work together:
- Power BI Desktop: A desktop application for creating reports and visualisations
- Power BI Service: A software as a service (SaaS) platform where you can share and view reports and dashboards
- Power BI Mobile Apps: Allowing on-the-go access for Windows, iOS and Android devices
Is Power BI Desktop free?
The Microsoft Power BI Desktop application is free to download and use. Microsoft Power BI Desktop allows you to access data, create data models, perform advanced analysis on data and create fully customisable reports which you can then publish to the Power BI online platform and share reports publicly on the internet without any additional charge.
To get started, you will need to sign in using a work email address.
There are some limitations regarding sharing and exporting – free and non-licensed users are unable to publish their reports to Microsoft SharePoint and cannot export reports to PowerPoint/CSV.
However, smaller companies that do not need to share reports internally can still get by with Power BI Desktop.
When do you need to pay for a licence?
A paid Power BI license is only required when you want to start sharing reports with other BI users in your business, or if you exceed the free storage quota. For more information about Power BI paid licences, visit our Power BI page.
How do I get started using Power BI?
Testing out Power BI Desktop is a great way to test the functionality before you commit to a paid licence. Here is our step-by-step guide to getting started with Power BI.
1. Download and install the Power BI Desktop application
First, you need to download the Power BI Desktop application. If you want to download a specific version or language, press ‘Advanced download options’. Then, press to install the application.
2. Connect Power BI Desktop to a data source
Power BI can connect to many data sources, allowing you to pull data from the various channels and locations you use. Click here to view the extensive list of connectors that are provided out of the box.
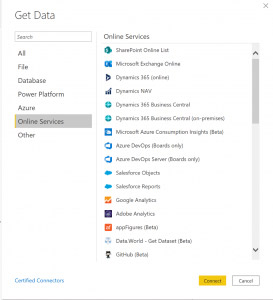
You can pull data into Power BI by opening. Power BI and click ‘Get Data’ on the splash screen.

Then, choose a data source:

3. Prepare your data for consumption
Next, you need to get your data into shape, as this will make it easier to work with.
Use Power Query to prepare and transform your data. Here, you’ll find hundreds of functions available to manipulate your data before loading it into the data model. This includes filtering and data cleansing. Plus, you can add additional condition columns.
This step isn’t necessary if your data is already in good shape, but can make life much simpler if it isn’t.
4. Perform some modelling
This step only applies if you are analysing a simple dataset from Excel or similar data source.
Start modelling your data by adding a relationship between tables, creating measures to perform specific calculations and creating calculated tables and columns.
5. Create your first report
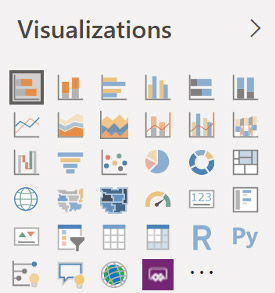
Now, you’re ready to create your first report! To begin, you need to visualise your data. You have two options in doing this. You can select visuals from the standard visuals, as below:

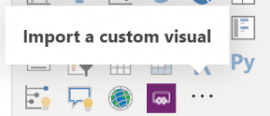
Or select custom visuals from AppSource:

Then you can easily drag and drop visuals onto the report canvas and format the visuals, until you’re happy with your final report.
Next steps
Once you have completed the above actions, you’ll have your first Power BI report. You can continue to experiment with Power BI, as over time you’ll learn more and create stronger reports.
Plus, there’s lots more you can do in Power BI. Our guide to sharing survey results in Power BI shows you to have to do just one of those things.
If you’re looking to take Power BI further to gain greater business value, we can help.
We have a dedicated team of Microsoft Power Platform consultants to help our customers implement and fully utilise these brilliant tools and applications, including Power BI.
We can help you build powerful dashboards and reports that allow your data to tell a story and drive better decisions across your operations.


